DELAFIELD, Wis. (Stockpickr) -- Trading stocks that trigger major breakouts can lead to massive profits. Once a stock trends to a new high or takes out a prior overhead resistance point, then it's free to find new buyers and momentum players who can ultimately push the stock significantly higher.
>>5 Stocks With Big Insider Buying
One example of a successful breakout trade I flagged recently was technology player Uni-Pixel (UNXL), which I featured in May 9's "5 Stocks Ready for Break Out" at $5.50 a share. I mentioned in that piece that shares of Uni-Pixel was starting to trend higher and move within range of triggering a near-term breakout trade above some key overhead resistance levels at $5.55 to $6 a share.
Guess what happened? Shares UNXL triggered that breakout in spades on Thursday with monster upside volume flows. Volume registered 5.78 million shares, which is well above its three-month average action of just 328,205 shares. This stock exploded sharply higher and it tagged an intraday high of $7.21 a share, which represents a monster gain of just over 30%.
As you can see, trading breakouts that trigger with heavy upside volume and rack up huge profits very quickly.
Breakout candidates are something that I tweet about on a daily basis. I frequently tweet out high-probability setups, breakout plays and stocks that are acting technically bullish. These are the stocks that often go on to make monster moves to the upside. What's great about breakout trading is that you focus on trend, price and volume. You don't have to concern yourself with anything else. The charts do all the talking.
>>5 Stocks Under $10 Set to Soar
Trading breakouts is not a new game on Wall Street. This strategy has been mastered by legendary traders such as William O'Neal, Stan Weinstein and Nicolas Darvas. These pros know that once a stock starts to break out above past resistance levels and hold above those breakout prices, then it can easily trend significantly higher.
With that in mind, here's a look at five stocks that are setting up to break out and trade higher from current levels.
CytRx
One biotechnology player that's quickly moving within range of triggering a big breakout trade is CytRx (CYTR), which operates as a biopharmaceutical research and development company specializing in oncology. This stock is off to a poor start in 2014, with shares down sharply by 28%.
>>5 Toxic Big Pharma Stocks to Sell Now
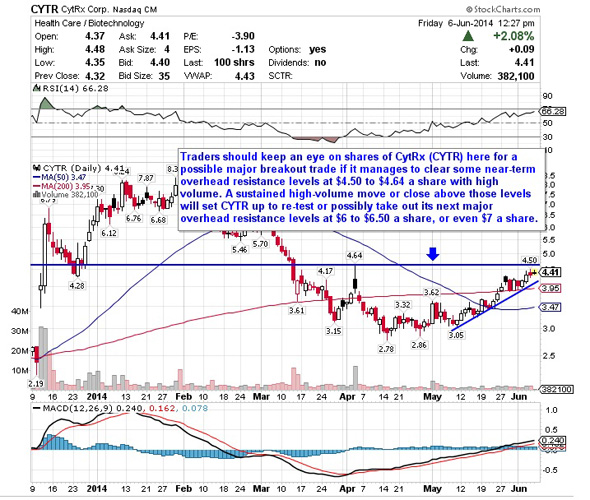
If you take a look at the chart for CytRx, you'll see that this stock has been uptrending strong for the last two months, with shares moving higher from its low of $2.78 to its recent high of $4.50 a share. During that uptrend, shares of CYTR have been consistently making higher lows and higher highs, which is bullish technical price action. That move has now pushed CYTR back above both its 50-day and 200-day moving averages, which is bullish. Shares of CYTR are now approaching a big breakout trade if this stock can manage to clear some key near-term overhead resistance levels.
Traders should now look for long-biased trades in CYTR if it manages to break out above some near-term overhead resistance levels at $4.50 to $4.64 a share with high volume. Look for a sustained move or close above those levels with volume that registers near or above its three-month average volume of 2.12 million shares. If that breakout triggers soon, then CYTR will set up to re-test or possibly take out its next major overhead resistance levels at $6 to $6.50 a share, or even $7 a share.
Traders can look to buy CYTR off weakness to anticipate that breakout and simply use a stop that sits right below its 200-day at $3.95 or its 50-day at $3.47 a share. One can also buy CYTR off strength once it starts to clear those breakout levels with volume and then simply use a stop that sits a comfortable percentage from your entry point.
Viggle
A media player that's starting to trend within range of triggering a big breakout trade is Viggle (VGGL), which provides an interactive platform to create engagement with TV content and targeted advertising through a loyalty program that rewards users for watching television. This stock hasn't done much over the last month, with shares off by 2%.
>>5 Stocks Set to Soar on Bullish Earnings
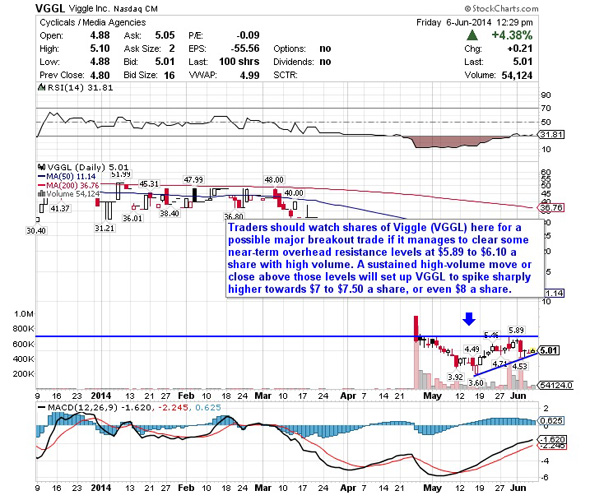
If you take a look at the chart for Viggle, you'll notice that this stock has been uptrending for the last month, with shares moving higher from its low of $3.60 to its recent high of $5.89 a share. During that uptrend, shares of VGGL have been making mostly higher lows and higher highs, which is bullish technical price action. Shares of VGGL are now starting to spike sharply higher today and the stock is quickly moving within range of triggering a big breakout trade above some key near-term overhead resistance levels.
Traders should now look for long-biased trades in VGGL if it manages to break out above some near-term overhead resistance levels at $5.89 to $6.10 a share with high volume. Look for a sustained move or close above those levels with volume that registers near or above its three-month average action of 54,743 shares. If that breakout starts soon, then VGGL will set up to spike sharply higher towards $7 to $7.50 a share, or even $8 a share.
Traders can look to buy VGGL off weakness to anticipate that breakout and simply use a stop that sits right below some key near-term support at $4.53 a share. One could also buy VGGL off strength once it starts to take out those breakout levels with volume and then simply use a stop that sits a comfortable percentage from your entry point.
Skullcandy
Another stock that's starting to move within range of triggering a near-term breakout trade is Skullcandy (SKUL), which designs, markets and distributes performance audio and gaming headphones, earbuds, speakers, apparel and other accessories under the Skullcandy, Astro Gaming and 2XL by Skullcandy brands in the U.S. and internationally. This stock is off to a decent start so far in 2014, with shares up around 8.4%.
>>3 Stocks Rising on Big Volume
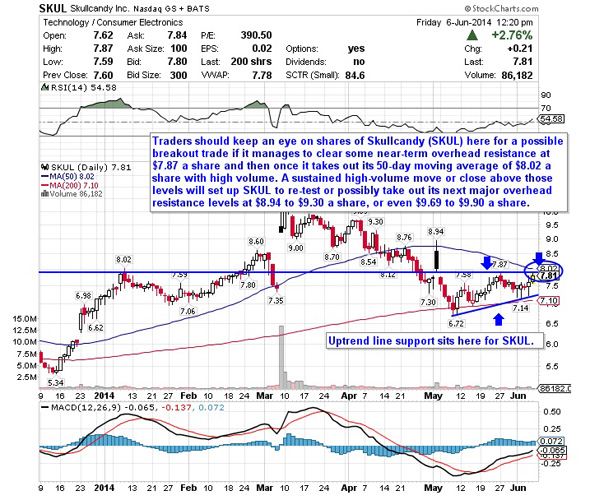
If you take a glance at the chart for Skullcandy, you'll notice that this stock has been uptrending over the last month, with shares moving higher from its low of $6.72 to its intraday high of $7.87 a share. During that uptrend, shares of SKUL have been riding above its 200-day moving average and the stock has been making mostly higher lows and higher highs, which is bullish technical price action. That move has now pushed shares of SKUL within range of triggering a big breakout trade above some key near-term overhead resistance levels.
Traders should now look for long-biased trades in SKUL if it manages to break out above some near-term overhead resistance levels at $7.87 a share and then once it takes out its 50-day moving average of $8.02 a share with high volume. Watch for a sustained move or close above those levels with volume that registers near or above its three-month average action of 752,783 shares. If that breakout kicks off soon, then SKUL will set up to re-test or possibly take out its next major overhead resistance levels at $8.94 to $9.30 a share, or even $9.69 to $9.90 a share.
Traders can look to buy SKUL off weakness to anticipate that breakout and simply use a stop that sits just below its 200-day moving average of $7.10 a share. One can also buy SKUL off strength once it starts to take out those breakout levels share with volume and then simply use a stop that sits a comfortable percentage from your entry point.
Quantum Fuel Systems Technologies Worldwide
Another stock that's starting to trend within range of triggering a major breakout trade is Quantum Fuel Systems Technologies Worldwide (QTWW), which develops, produces and sells natural gas fuel storage systems and integrates vehicle system technologies in the U.S., Germany, Canada, India, Spain and Taiwan. This stock has been hit hard by the bears so far in 2014, with shares down sharply by 44%.
>>5 Utility Stocks Hedge Funds Love
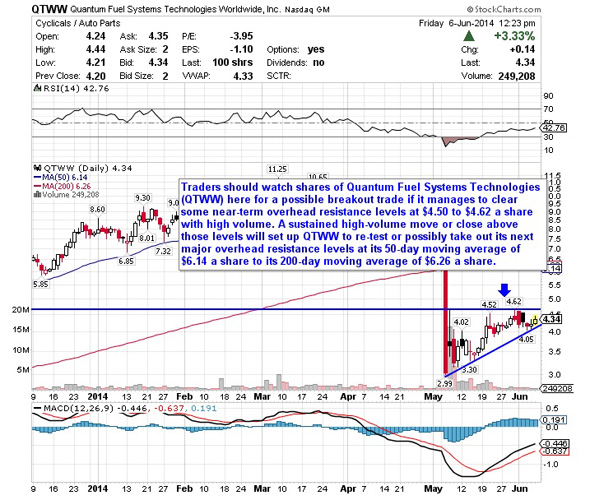
If you look at the chart for Quantum Fuel Systems Technologies Worldwide, you'll see that this stock has been uptrending strong for the last month, with shares moving higher from its low of $2.99 to its recent high of $4.62 a share. During that uptrend, shares of QTWW have been making mostly higher lows and higher highs, which is bullish technical price action. Shares of QTWW are now starting to spike higher off some near-term support at $4.05 a share and it's quickly moving within range of triggering a major breakout trade above some key near-term overhead resistance levels.
Traders should now look for long-biased trades in QTWW if it manages to break out above some near-term overhead resistance levels at $4.50 to $4.62 a share with high volume. Look for a sustained move or close above those levels with volume that hits near or above its three-month average action of 1.39 million shares. If that breakout materializes soon, then QTWW will set up to re-test or possibly take out its next major overhead resistance levels at its 50-day moving average of $6.14 a share to its 200-day moving average of $6.26 a share.
Traders can look to buy QTWW off weakness to anticipate that breakout and simply use a stop that sits just below some key near-term support at $4.05 or at $3.88 a share. One can also buy QTWW off strength once it starts to bust above those breakout levels with volume and then simply use a stop that sits a comfortable percentage from your entry point.
You On Demand
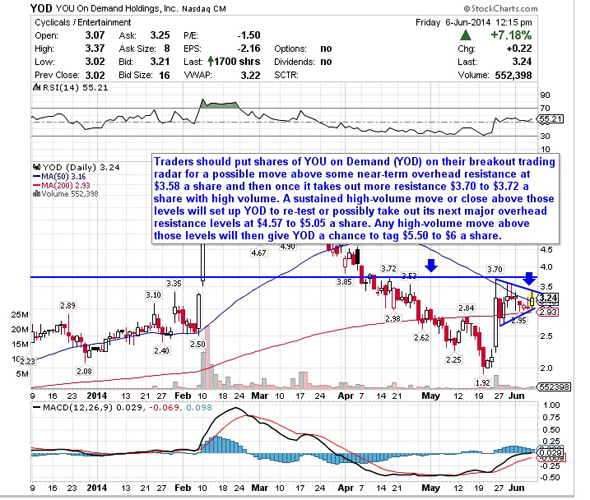
My final breakout trading prospect is broadcasting player You On Demand (YOD), which provides integrated value-added service solutions for the delivery of video on demand and enhanced premium content for digital cable providers, Internet protocol television providers, over-the-top providers, and mobile manufacturers in the People's Republic of China. This stock is off to a strong start in 2014, with shares up sharply by 42%.
If you look at the chart for YOU on Demand, you'll see that this stock is spiking sharply higher today right off its 200-day moving average of $2.93 and back above its 50-day moving average of $3.16 a share. This stock is quickly pushing shares of YOD within range of triggering a major breakout trade above a key downtrend line and above some key near-term overhead resistance levels.
Traders should now look for long-biased trades in YOD if it manages to break out above some near-term overhead resistance at $3.58 a share and then once it takes out more resistance $3.70 to $3.72 a share with high volume. Look for a sustained move or close above those levels with volume that registers near or above its three-month average action of 967,227 shares. If that breakout kicks off soon, then YOD will set up to re-test or possibly take out its next major overhead resistance levels at $4.57 to $5.05 a share. Any high-volume move above those levels will then give YOD a chance to tag $5.50 to $6 a share.
Traders can look to buy YOD off weakness to anticipate that breakout and simply use a stop that sits right below some key near-term support levels at $2.95 or at $2.66 a share. One can also buy YOD off strength once it starts to clear those breakout levels with volume and then simply use a stop that sits a conformable percentage from your entry point.
To see more breakout candidates, check out the Breakout Stocks of the Week portfolio on Stockpickr.
-- Written by Roberto Pedone in Delafield, Wis.
RELATED LINKS:
>>The Next Alt Anergy Stocks Poised to Explode Higher
>>5 Big Stock Trades to Buy in June
>>3 Stocks Under $10 Making Big Moves
Follow Stockpickr on Twitter and become a fan on Facebook.
At the time of publication, author had no positions in stocks mentioned.
Roberto Pedone, based out of Delafield, Wis., is an independent trader who focuses on technical analysis for small- and large-cap stocks, options, futures, commodities and currencies. Roberto studied international business at the Milwaukee School of Engineering, and he spent a year overseas studying business in Lubeck, Germany. His work has appeared on financial outlets including
CNBC.com and Forbes.com. You can follow Pedone on Twitter at www.twitter.com/zerosum24 or @zerosum24.


 Related ABX Markets Debut Week On Negative Note; S&P 500 Falls Through Key Level Benzinga's Top Upgrades M&A Activity Boosts U.S. Stock Futures (Fox Business)
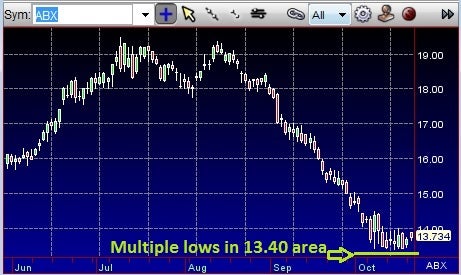

 (iStock)


