 Related ABX Markets Debut Week On Negative Note; S&P 500 Falls Through Key Level Benzinga's Top Upgrades M&A Activity Boosts U.S. Stock Futures (Fox Business)
 Gold stocks have been out of favor for quite some time. As the bullion peaked at the $1950.00 level in August 2011, it has been in a slow and steady decline.
The reason for its ascent from its lows in 2008 at the $750.00 level were all of sudden no longer valid.
Meanwhile, gold producers ramped up their production during this period, anticipating higher and higher prices. Unfortunately for gold miners, their timing could not have been worse. The decline from its highs has continued as gold has breached the $1200 level on a few different occasions over the last 16 months.
The slide in price of the bullion has had a devastating impact on the price of gold and gold-mining stocks. Barrick Gold Corporation (USA) (NYSE: ABX), for example, has declined from its all-time high made in September 2011 ($55.95) to $13.40 last week.
Related Link: Sometimes You Need To Close Your Eyes And Buy
Gold Rallies, But Not BarrickEven as the markets panicked on Ebola fears and gold rallied, many of the gold miners barely moved. As gold has rallied from its October 6 low ($1183.30) to north of $1250.00, Barrick Gold has declined from its close on that day ($14.24) to $13.40. Any investor that purchased Barrick Gold in anticipation of a sympathy move must be scratching their head.
While some of the other miners have mounted a rally, Barrick Gold has traded in a well-defined range over the last eight trading sessions. After rising with gold's initial move off its recent lows, Barrick Gold briefly rallied to the $14.50 level. As gold has continued to rally, however, Barrick Gold has been stuck under $14.00.
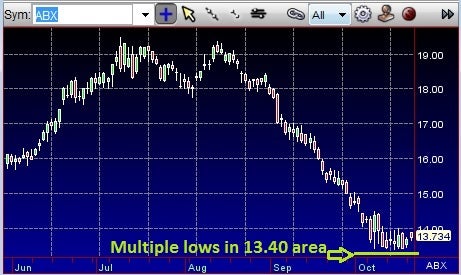
Chart courtesy of Neovest
Major ConsolidationOver the last eight trading sessions, it has found resistance at the $14.00 level. It has also made lows between $13.40 and $13.50 over the last 10 trading sessions. It has found support just ahead of that level at $13.73, at time of writing. This type of technical trading pattern can be interpreted in two different ways.
The bullish scenario would be that large investors or institutions are loading the boat. Those investors are banking on this area, the same area it bottomed in July 2002, as the bottom. As a result, shorts that are looking for continued downside are throwing in the towel and covering in the same area.
The other scenario is that this is just a pause in another leg down for the issue. On many occasions when an issue has a similar chart pattern to this, it is just a pause in the continuation of a longer-term trend.
For investors looking to find a level of support to lean on, Barrick Gold has provided one. A breach of the $13.40 level could be a strong indication of another leg lower in the downtrodden issue.
Tune in every morning, Monday-Friday, from 8-9:45 AM EST to hear Joel Elconin and Dennis Dick discuss what's moving the markets and why on Benzinga's #PreMarket Prep.
Posted-In: GoldTechnicals Commodities Intraday Update Markets Trading Ideas Best of Benzinga
© 2014 Benzinga.com. Benzinga does not provide investment advice. All rights reserved.
Related Articles (ABX) Talking About Support? Barrick Gold Has Found It Markets Debut Week On Negative Note; S&P 500 Falls Through Key Level Benzinga's Top Upgrades HSBC Upgrades Barrick Gold To Overweight Barrick Gold Corporation Oversold And At Support Morgan Stanley Sees Mixed Factors For Barrick Gold Corporation Around the Web, We're Loving... World Cup Championship of Binary Options!
No comments:
Post a Comment