BALTIMORE (Stockpickr) -- All eyes are on Janet Yellen this morning, as she sits for the biggest job interview of her life: her confirmation hearing for the Fed chairmanship.
But she's not exactly shocking anyone with her testimony. Yellen is in favor of QE? She supports Bernanke's policies? The faucet stays on for another four years? Quelle surprise.
Still, stocks are getting boosted as investors salivate over the prospect of more cash flowing into the system. As a trader, who am I to judge? Instead, I'm taking a technical look at five big names that look tradable this week.
If you're new to technical analysis, here's the executive summary.
Technicals are a study of the market itself. Since the market is ultimately the only mechanism that determines a stock's price, technical analysis is a valuable tool even in the roughest of trading conditions. Technical charts are used every day by proprietary trading floors, Wall Street's biggest financial firms, and individual investors to get an edge on the market. And research shows that skilled technical traders can bank gains as much as 90% of the time.
Every week, I take an in-depth look at big names that are telling important technical stories. Here's this week's look at five high-volume stocks to trade this week.
PetroChina
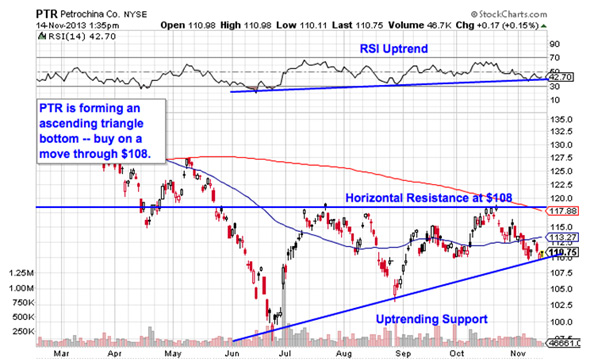
First up is Chinese oil and gas giant PetroChina (PTR). Saying PetroChina has seen a rough 2013 is an understatement. Year-to-date, shares of the $203 billion firm have slipped more than 22% at the same time that the S&P 500 has been in rally mode. But shareholders could be in store for a reprieve this winter thanks to a bullish setup that's been forming in shares of late.
PetroChina is currently forming an ascending triangle bottom, a trading setup that's formed by a horizontal resistance level to the upside at $118 and uptrending support below shares. Basically, as PTR bounces between those two levels, it's getting squeezed closer and closer to a breakout above the $118 price ceiling. When that breakout happens, it's time to be a buyer.
Whenever you're looking at any technical price pattern, it's critical to think in terms of those buyers and sellers. Triangles and other pattern names are a good quick way to explain what's going on in a stock, but they're not the reason it's tradable. Instead, it all comes down to supply and demand for shares.
That $28 resistance level is a price where there has been an excess of supply of shares; in other words, it's a place where sellers had been more eager to step in and take gains than buyers were to buy. That's what makes this week's breakout above it so significant. The move means that buyers are finally strong enough to absorb all of the excess supply above that price level.
If you decide to take the Pandora trade, I'd recommend keeping a protective stop at the 50-day moving average.
Annaly Capital Management
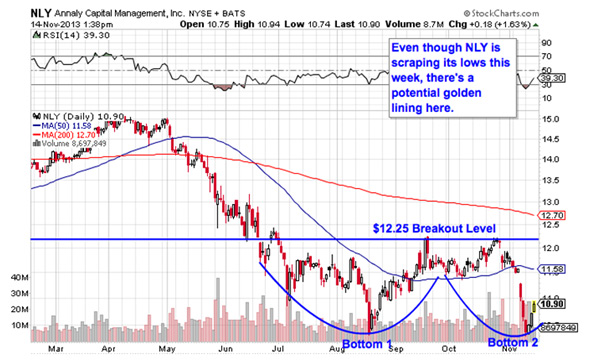
There's no two ways about it: Annaly Capital Management (NLY) has gotten rocked this year. As I write, the $10 billion mortgage REIT is underperforming the S&P by 48% since the beginning of January. That's a pretty painful shortfall for investors -- but NLY could be near a turnaround right now.
That's because NLY is currently forming a double bottom pattern, a bullish reversal setup that's formed by two lows that bottom out around the same price level. They're separated by a breakout level to the upside at $12.25 -- a move through that price is our buy signal on this stock. As I write, NLY is still very close to the number-two bottom that it made just a few sessions ago, so while it's bullish that shares hit the brakes at their old support level, it's early to start getting too aggressive with this trade.
A move through $12.25 would be a pretty major trend reversal in NLY, but it's still a little while away. Still, the sheer underperformance at NLY means that it could try to play catch-up quickly. Put this trade in your watch list.
Discover Financial Services
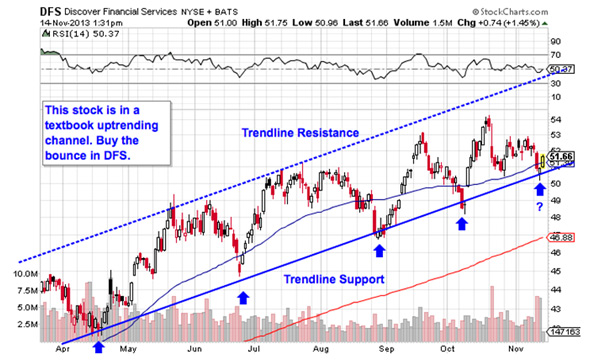
The situation in shares of Discover Financial Services (DFS) is a little more pressing -- and you don't need to be an expert technical analyst to see why. This $25 billion payment network stock has been locked in a textbook uptrending channel since April, and with shares at support this week, it makes sense to buy the bounce.
The channel in DFS is important because it provides us with a high-probability range for shares to stay within both on the upside and the downside. More important, trendline support has halted shares' pullbacks perfectly on the last four touches of the level – now we're hitting touch No. 5. With a bounce in play in this morning's session, now's a perfect time to take on a position.
Buying off a support bounce makes sense for two big reasons: It's the spot where shares have the furthest to move up before they hit resistance, and it's the spot where the risk is the least (because shares have the least room to move lower before you know you're wrong). Remember, all trend lines do eventually break, but by actually waiting for the bounce to happen first, we're ensuring the DFS can actually still catch a bid along that line. Keep a tight stop in place under the channel if you decide to buy here.
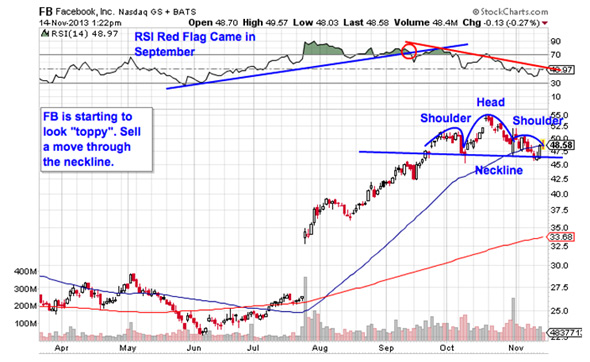
Hedge funds have been buying Facebook (FB) with both hands in the last quarter. But from a technical standpoint, it's starting to look like their timing could be off. Facebook has seen a stellar fun since the breakout back in July, but this stock is starting to look "toppy" now.
FB is currently forming a head and shoulders top, a bearish pattern that indicates exhaustion among buyers. The setup is formed by two swing highs that top out around the same level (the shoulders), separated by a higher high in between them (the head). The neckline, at $46 on the chart above, is the trigger level to watch. A slip below that neckline means that it's time to sell (or short) the social network.
RSI signaled a red flag for Facebook all the way back in September, when the uptrend in the momentum gauge stalled out and flipped to a downtrend. That was the signal that buying pressure was waning in shares -- a move through $46 is the signal that sellers are now in control.
To see this week's trades in action, check out this week's Must-See Charts portfolio on Stockpickr.
-- Written by Jonas Elmerraji in Baltimore.
No comments:
Post a Comment