
It goes against my natural inclination to lean bearish... But two technical indicators say the stock market is now oversold and stocks may be ready to rally – at least in the short term... Take a look at this chart of the McClellan Oscillator...

The McClellan Oscillator is a momentum indicator that compares advancing and declining issues and illustrates overbought and oversold conditions. At -80, the blue line shows each time over the past two years when the stock market reached "extreme" oversold levels. Here's how the S&P 500 performed after each time...
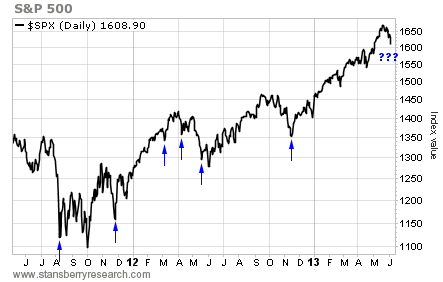
Oversold readings on the McClellan Oscillator didn't always mark the absolute bottom of intermediate-term corrections. But the market bounced each time – if only to relieve the oversold condition.
We also have a stock market buy signal from the Volatility Index (the "VIX"). Here's a chart of the VIX plotted against its Bollinger Bands...
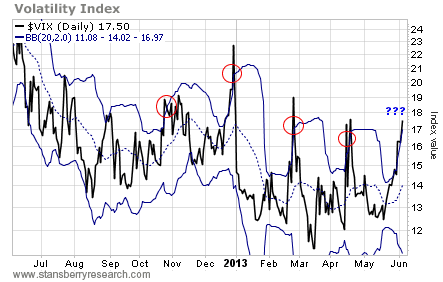
On Monday, the VIX closed above its upper Bollinger Band – which indicates an extreme move. It closed back inside the bands on Tuesday. That action triggered a VIX sell signal – which is the same as a broad stock market buy signal. As you can see from the chart, each time this happened over the past year, it marked a short-term top in the VIX. It also occurred near a short-term bottom for stock prices. Take a look...
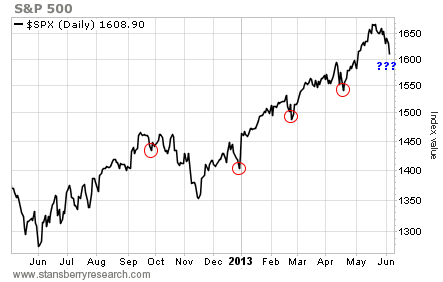
There are still plenty of reasons to be cautious on stock prices. And the market may go even lower over the next few months. But for the short term – the next several days or so – these two indicators suggest stocks are due for a bounce. – Jeff Clark
No comments:
Post a Comment