BALTIMORE (Stockpickr) -- "The best way to become a millionaire is to start as a billionaire and buy an airline." That old joke has been the common wisdom in recent years when it's come to airline investing. Airlines have huge cost burdens, they face major regulatory pressures, and they go bankrupt left and right.
>>5 Rocket Stocks Ready for Blastoff
That's why this year's airline rally has caught so many people by surprise. In a year when few stocks are performing well, the airline industry has been a high flyer, climbing around 15% since the calendar flipped to January. Zoom out to last May, and those gains climb to more than 30%.
Airline industry gains aren't some fluke. Instead, the airline business is the poster child for a cyclical business; after the painful restructurings of 2008, it's no surprise that airlines are faring well coming out of a major cyclical low, even in the face of triple-digit oil prices.
That's why we're taking a closer look at the technical trading setups in five big airline stock charts today.
>>Sell These 5 Toxic Stocks Before It's Too Late
For the unfamiliar, technical analysis is a way for investors to quantify qualitative factors, such as investor psychology, based on a stock's price action and trends. Once the domain of cloistered trading teams on Wall Street, technicals can help top traders make consistently profitable trades and can aid fundamental investors in better planning their stock execution.
Without further ado, let's take a look at five technical setups worth trading now.
United Continental Holdings
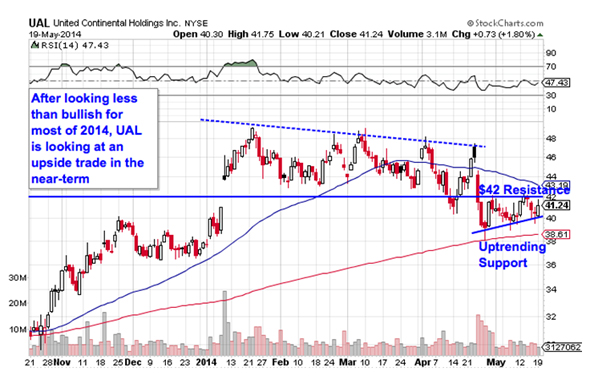
First up is United Continental Holdings (UAL), an airline name that's been one of the least inspiring performers year-to-date. After rallying hard to start January, UAL has spent the months since consolidating sideways, down around 15% from the high water mark shares set at the beginning of the year. But UAL could be getting ready to make up for that lost ground. In the short-term, shares are looking bullish again.
>>3 Stocks Breaking Out on Big Volume
That's thanks to an ascending triangle setup that's been shaping up in shares of UAL since the last week of April. The pattern is formed by horizontal resistance above shares at $42 and uptrending support to the downside. Basically, as UAL bounces in between those two technically important levels, it's getting squeezed closer and closer to a breakout above that $42 price ceiling. When that happens, we've got a buy signal.
The short-term size of the price pattern in UAL comes with equally short-term trading implications. But the bullish move could be just enough to break shares of United Continental above the dashed trend line at the top of the chart. If that happens, we've got a secondary buying opportunity in this $15.5 billion airline.
UAL hasn't been the most attractive airline name in 2014, but that could be about to change.
Delta Air Lines
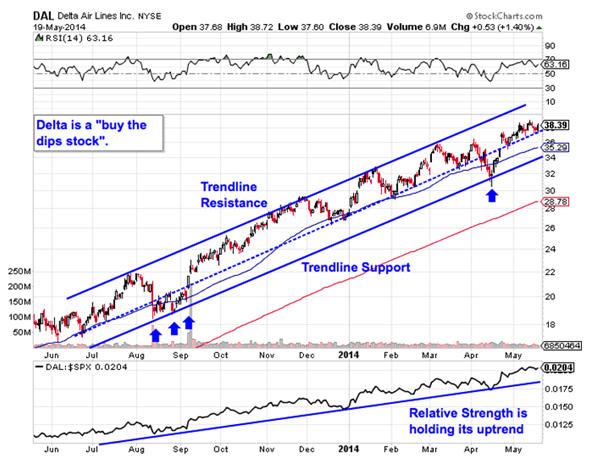
Delta Air Lines (DAL), on the other hand, has been one of the most attractive airline trades this year. Since the calendar flipped to January, Delta has rallied 40% -- and that's on top of the gains that this airline returned to investors last year. Now this stock is positioned for even higher ground; and you don't have to be an expert technical trader to see why.
>>4 Huge Stocks on Traders' Radars
For the last year, Delta has been bouncing higher in an uptrending channel, a pair of parallel trend lines that have given traders a very high probability range for shares to remain with. Put another way, an ideal buying opportunity has come up for DAL bulls every time this stock has bounced off of trend line support along the bottom of the channel. Trend channels are about as simple as trading patterns get: Up is good and down is bad. So, with DAL's chart pointing up and to the right, this is very much a "buy the dips stock."
Relative strength adds some important backup for a buy signal in Delta. That performance indicator has been in an uptrend since back in August, a signal that DAL is continually outperforming the S&P in good times and in bad ones.
Alaska Air Group
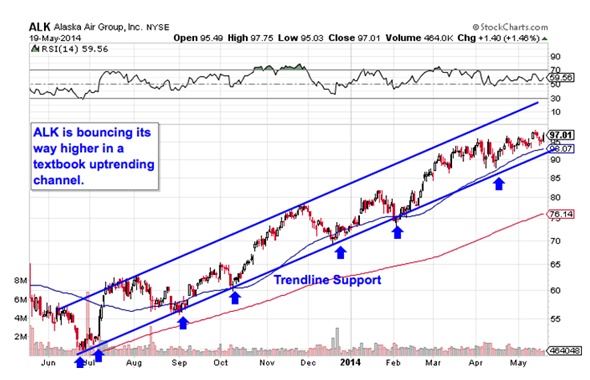
We're seeing the exact same setup in shares of Alaska Air Group (ALK), the $7 billion holding company that owns Alaska Airlines and Horizon Air. Like Delta, Alaska Air has been bouncing its way higher in a textbook trend channel. Now it makes sense to buy this stock's next bounce off of support.
>>5 Stocks Ready to Break Out
Waiting for a meaningful bounce off of support is crucial for two big reasons: It's the spot where shares have the furthest to move up before they hit resistance, and it's also the spot where the risk is the least (because shares have the least room to move lower before you know you're wrong). Remember, all trend lines do eventually break, but by actually waiting for the bounce to happen first, you're ensuring ALK can actually still catch a bid along that line before you put your money on shares.
The 50-day moving average has been a good proxy for support on the way up. That makes it a logical place to keep a protective stop if you decide to buy here.
American Airlines Group
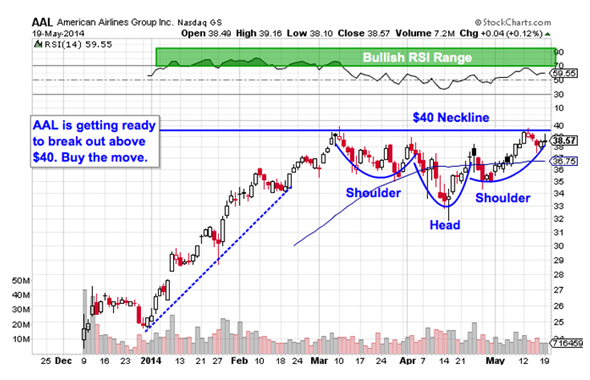
Since going public at the end of last year following its exit from bankruptcy protection, American Airlines Group (AAL) has been a spectacular performer. With its burdensome cost structure shed, shares have been free to rally 57% over that stretch of time. And they could be headed even higher this summer thanks to an inverse head and shoulders setup in shares.
>>Hedge Funds Hate These 5 Stocks -- Should You?
The inverse head and shoulders is a classic technical setup that indicates exhaustion among sellers. The pattern is formed by two swing lows that bottom out around the same level (the shoulders), separated by a bigger trough called the head; the buy signal comes on the breakout above the pattern's "neckline" level, currently right at $40.
Why all the significance at $40? It all comes down to buyers and sellers. Price patterns are a good quick way to identify what's going on in the price action, but they're not the reason a stock is tradable. Instead, the "why" comes down to basic supply and demand for American Airlines' stock.
The $40 neckline level is a price where there has been an excess of supply of shares; in other words, it's a spot where sellers have previously been more eager to step in and take gains than buyers have been to buy. That's what makes a breakout above $40 so significant -- the move means that buyers are finally strong enough to absorb all of the excess supply above that price level.
Momentum has been overbought for much of AAL's rally. That's because, contrary to popular belief, momentum extremes are better signals that a stock is trending than they are contrarian indicators. Expect AAL to go overbought again before the breakout.
Hawaiian Holdings
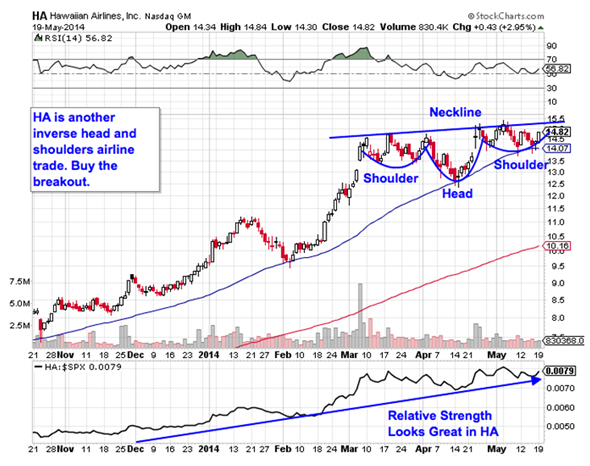
Last up is Hawaiian Holdings (HA), the holding company that owns Hawaiian Airlines. Like American, Hawaiian is currently forming an inverse head and shoulders pattern at the top of shares' recent price range. While the inverse head and shoulders is typically spotted at the end of a downtrend rather than near highs, the trading implications are exactly the same on a push through this stock's neckline.
The neckline level to watch in HA right now is $15.50.
Relative strength has maintained its uptrend in Hawaiian even while this name consolidated in the inverse head and shoulders pattern, a good indication that this small-cap stock is extremely well positioned heading into the summer. HA's ability to outperform the S&P 500 is a valuable commodity to have in your portfolio; it'll become even more valuable when shares breakout above $15.50.
Lest you think that the head and shoulders is too well known to be worth trading, the research suggests otherwise: a recent academic study conducted by the Federal Reserve Board of New York found that the results of 10,000 computer-simulated head-and-shoulders trades resulted in "profits [that] would have been both statistically and economically significant."
That's good reason to keep an eye on both HA and AAL this week.
To see this week's trades in action, check out the Technical Setups for the Week portfolio on Stockpickr.
-- Written by Jonas Elmerraji in Baltimore.
RELATED LINKS:
>>5 Stocks Insiders Love Right Now
>>5 Stocks Set to Soar on Bullish Earnings
>>5 Big Stocks to Trade for Gains This Summer
Follow Stockpickr on Twitter and become a fan on Facebook.
At the time of publication, author had no positions in stocks mentioned.
Jonas Elmerraji, CMT, is a senior market analyst at Agora Financial in Baltimore and a contributor to
TheStreet. Before that, he managed a portfolio of stocks for an investment advisory returned 15% in 2008. He has been featured in Forbes , Investor's Business Daily, and on CNBC.com. Jonas holds a degree in financial economics from UMBC and the Chartered Market Technician designation.Follow Jonas on Twitter @JonasElmerraji
No comments:
Post a Comment