BALTIMORE (Stockpickr) -- Geopolitical turmoil has been ramping up anxiety in the markets in 2014, with escalating conflicts in Ukraine and the Middle East. No names are more exposed to that news cycle than the defense contractors, but by and large, defense stocks haven't moved much in reaction to the headlines. Until now.
>>5 Hated Earnings Stocks You Should Love
After trailing the S&P 500 to start the year, defense contractors are starting to show some signs of life again. And as anxiety creeps higher this earnings season, the defensive investment properties of defense contractors could help secure your gains this year – especially as breakout trades start popping up in the individual names.
So today, we're taking a closer technical look at five defense sector stocks that look ready to move higher.
For the unfamiliar, technical analysis is a way for investors to quantify qualitative factors, such as investor psychology, based on a stock's price action and trends. Once the domain of cloistered trading teams on Wall Street, technicals can help top traders make consistently profitable trades and can aid fundamental investors in better planning their stock execution.
>>5 Rocket Stocks to Buy for Blastoff Earnings Season Gains
Without further ado, let's take a look at five technical setups worth trading now.
Lockheed Martin
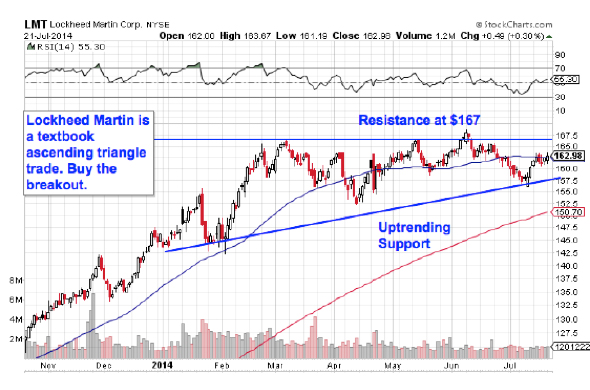
Up first is $52 billion defense contracting giant Lockheed Martin (LMT). Lockheed has actually turned out some impressive performance year-to-date: Shares of the defense and aerospace firm have rallied more than 10% since the start of the year. But a long-term bullish setup points to even higher ground in the second half of 2014.
>>4 Big-Volume Stocks in Breakout Territory
Lockheed Martin is currently forming an ascending triangle pattern, a bullish setup that's formed by horizontal resistance above shares (in this case at $167) and uptrending support to the downside. Basically, as LMT bounces in between those two technically important levels, it's getting squeezed closer and closer to a breakout above that $167 price ceiling. When that happens, we've got our buy signal in LMT.
Why all of that significance at $167? It all comes down to buyers and sellers. Price patterns are a good quick way to identify what's going on in the price action, but they're not the actual reason a stock is tradable. Instead, the "why" comes down to basic supply and demand for Lockheed's stock.
The $167 resistance level is a price where there has been an excess of supply of shares; in other words, it's a spot where sellers have previously been more eager to step in and take gains than buyers have been to buy. That's what makes a breakout above $167 so significant -- the move means that buyers are finally strong enough to absorb all of the excess supply above that price level.
This morning's second-quarter earnings release could be a catalyst to help propel LMT up to test resistance at $167, but it's important to remember not to buy shares in anticipation of the breakout. Instead, the high-probability trade is all about being reactionary. Shares have been swatted down on their last four attempts through $167, so it's key to wait for that price level to get taken out before you buy.
CAE
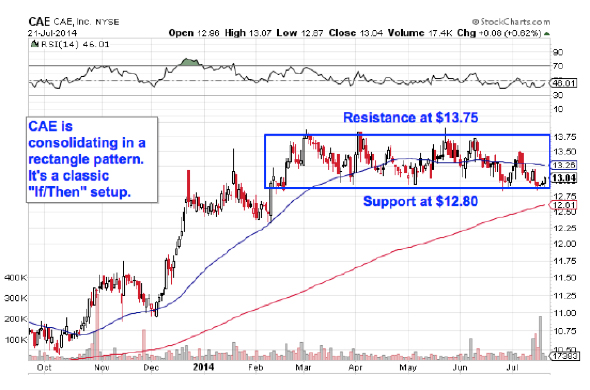
Moving down the food chain brings us to CAE (CAE) a Canadian mid-cap defense and aerospace stock that's forming a tradable breakout setup of its own right now.
>>4 Hot Stocks to Trade (or Not)
CAE is forming a rectangle pattern, a price setup that's formed by a pair of horizontal resistance and support levels that basically "box in" shares between $13.75 and $12.80. Consolidations like the one in CAE are common after big moves (like the one that started last fall); they give the stock a chance to bleed off momentum as buyers and sellers figure out their next move.
Rectangles are "if/then patterns" – put a different way, if CAE breaks out through resistance at $13.75, then traders have a buy signal. Otherwise, if the stock violates support at $12.80, then the high-probability trade is a sell. Since CAE's price action leading up to the rectangle was an uptrend, it favors breaking out above $13.75.
General Dynamics
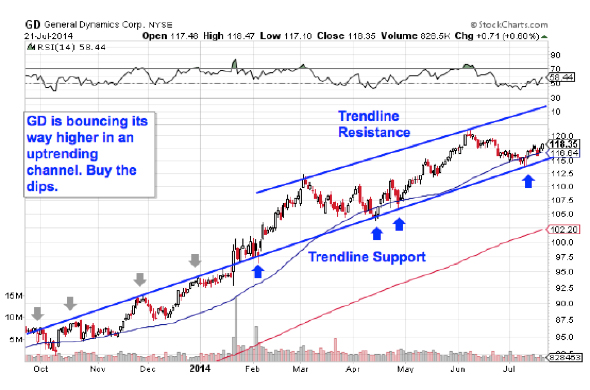
$40 billion defense name General Dynamics (GD) has been one of the best-performing stocks in the sector this year. Since the calendar flipped to January, GD is up close to 24%. From here, shares look primed to keep up that trajectory in the second half of 2014, and you don't need to be an expert technical trader to figure out why.
>>5 Stocks Ready for Breakouts
General Dynamics has spent almost all year bouncing its way higher in a well-defined uptrending channel, a pair of parallel trend lines that's provided traders with a high probability range for shares of GD to trade within. When it comes to trend channels, up is good and down is bad – it's really just as simple as that. Every successive test of trend line support has provided an optimal entry point for traders looking for buying opportunities in GD, so as shares bounce off of support for a fourth time here, now's a good time to join the buyers.
The 50-day moving average has been a good proxy for support on the way up since the channel started. That makes it a logical place to keep a protective stop if you decide to jump in on the move.
Esterline Technologies
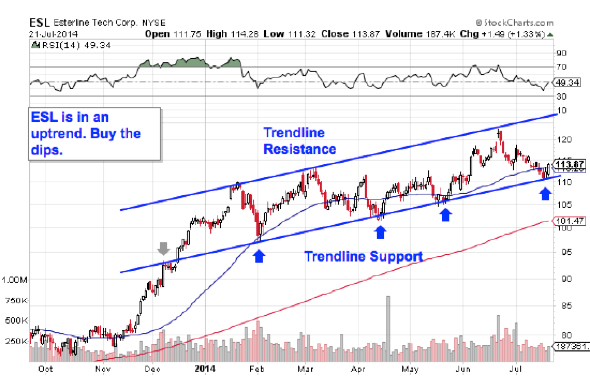
Mid-cap defense contractor Esterline Technologies (ESL) is another stock that's showing traders the exact same simple trade setup this week. Like GD, ESL has been bouncing its way higher in an uptrending channel for most of 2014. Out simply, it's a "buy the dips stock", and from here, it makes sense to be a buyer on the next bounce off of trend line support.
>>5 Dividend Stocks Ready to Pay You More
Waiting for a bounce off of trend line support is a key risk management strategy for ESL buyers for two big reasons: It's the spot where shares have the furthest to move up before they hit resistance, and it's also the spot where the risk is the least (because shares have the least room to move lower before you know you're wrong). Remember, all trend lines do eventually break, but by actually waiting for the bounce to happen first, you're ensuring Esterline can actually still catch a bid along that line before you put your money on shares.
Today looks like a good opportunity to get in on ESL's latest trend line bounce.
Raytheon
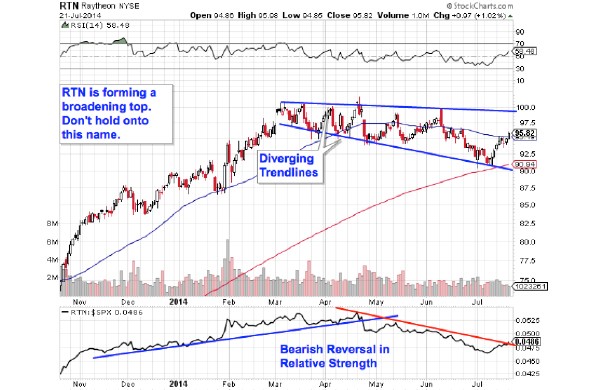
Not all names we're looking at today are bullish. $30 billion defense name Raytheon (RTN) has been looking anemic for most of 2014, and now traders are getting a pretty strong signal that it's time to be a seller. Here's why.
Raytheon is currently forming a broadening top pattern, a technical setup that looks exactly like it sounds. The setup formed by a pair of support and resistance levels that are diverging after a big move higher. The real problem of a broadening top is the fact that it indicates downside volatility is getting injected into shares. Like the setup we saw in CAE, Raytheon's pattern is a breakdown trade. That means a move through support (currently at $90) is the sell signal.
But I wouldn't recommend waiting that long. Since support is trending lower in RTN, shares can move substantially lower without actually ever breaking down through that downsloping support level. For that reason, it makes sense to sell RTN here rather than wait.
That's confirmed by relative strength right now. RTN's relative strength uptrend broke in late April, a signal that shares are statistically more apt to underperform the S&P 500 for the next three-to-ten month span. There are plenty of bullish defense sector names worth buying this week -- but Raytheon isn't one of them.
To see this week's trades in action, check out the Technical Setups for the Week portfolio on Stockpickr.
-- Written by Jonas Elmerraji in Baltimore.
RELATED LINKS:
>>5 Big Stocks to Trade for Gains This Summer
>>5 Stocks With Big Insider Buying
>>3 Huge Tech Stocks on Traders' Radars
Follow Stockpickr on Twitter and become a fan on Facebook.
At the time of publication, author had no positions in stocks mentioned.
Jonas Elmerraji, CMT, is a senior market analyst at Agora Financial in Baltimore and a contributor to
TheStreet. Before that, he managed a portfolio of stocks for an investment advisory returned 15% in 2008. He has been featured in Forbes , Investor's Business Daily, and on CNBC.com. Jonas holds a degree in financial economics from UMBC and the Chartered Market Technician designation.Follow Jonas on Twitter @JonasElmerraji
No comments:
Post a Comment